Introduction
descriptive analytics
Welcome to the Analytics Snippet Collection, a curated selection of code examples and practical tips for working with analytics data.
Create Sample Data
By calling, describe.sample_data we can generate head and tail from dataframe.
describe.sample_data(df[["survived", "pclass", "sex", "age"]],n=10)
This function requires the following parameters:
- main_data (
dataframe): Data Input - n (
int): total row
The result
| survived | pclass | sex | age | survived | pclass | sex | age | |||
|---|---|---|---|---|---|---|---|---|---|---|
| 0 | 0 | 3 | male | 22 | < head | tail > | 0 | 3 | male | 33 |
| 1 | 1 | 1 | female | 38 | < head | tail > | 0 | 3 | female | 22 |
| 2 | 1 | 3 | female | 26 | < head | tail > | 0 | 2 | male | 28 |
| 3 | 1 | 1 | female | 35 | < head | tail > | 0 | 3 | male | 25 |
| 4 | 0 | 3 | male | 35 | < head | tail > | 0 | 3 | female | 39 |
| 5 | 0 | 3 | male | nan | < head | tail > | 0 | 2 | male | 27 |
| 6 | 0 | 1 | male | 54 | < head | tail > | 1 | 1 | female | 19 |
| 7 | 0 | 3 | male | 2 | < head | tail > | 0 | 3 | female | nan |
| 8 | 1 | 3 | female | 27 | < head | tail > | 1 | 1 | male | 26 |
| 9 | 1 | 2 | female | 14 | < head | tail > | 0 | 3 | male | 32 |
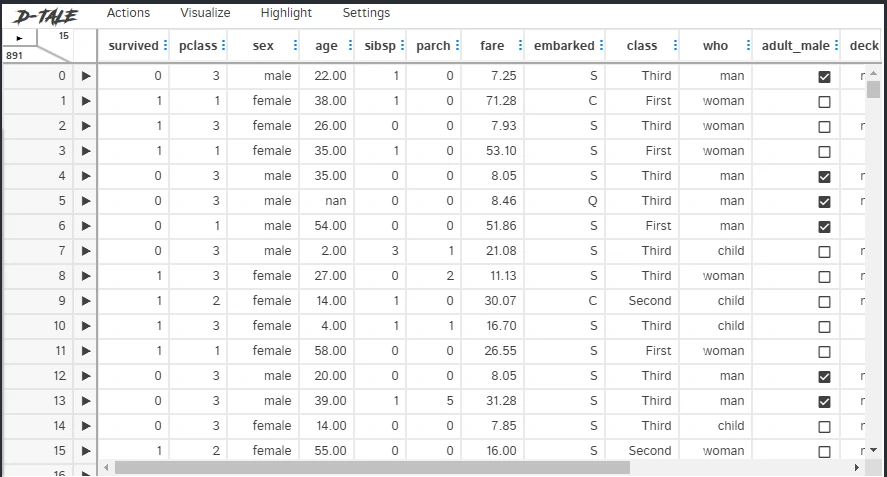
Interactive table
By calling, describe.df_to_sheet we can generate interactive table.
describe.df_to_sheet(df)
This function requires the following parameters:
- main_data (
dataframe): Data Input
The result
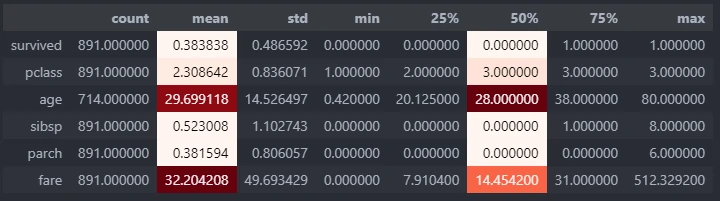
Numeric description
By calling, describe.describe_num we can generate more advance numeric description table.
describe.describe_num(df)
This function requires the following parameters:
- main_data (
dataframe): Data Input
The result
Generate higher and lower number from a column
By calling, describe.n_large_small we can generate n higher and lower number from specific column.
describe.n_large_small(main_data,col,n)
This function requires the following parameters:
- main_data (
dataframe): Data Input - col (
string): column name - n (
int): number or row to be shown
The result
| survived | pclass | sex | age | sibsp | parch | fare | embarked | class | who | adult_male | deck | embark_town | alive | alone | |
|---|---|---|---|---|---|---|---|---|---|---|---|---|---|---|---|
| 803 | 1 | 3 | male | 0.42 | 0 | 1 | 8.5167 | C | Third | child | False | nan | Cherbourg | yes | False |
| 755 | 1 | 2 | male | 0.67 | 1 | 1 | 14.5 | S | Second | child | False | nan | Southampton | yes | False |
| 630 | 1 | 1 | male | 80 | 0 | 0 | 30 | S | First | man | True | A | Southampton | yes | True |
| 851 | 0 | 3 | male | 74 | 0 | 0 | 7.775 | S | Third | man | True | nan | Southampton | no | True |
Show value count for every unique in single column
By calling, describe.n_large_small we can generate value count for every unique in single column and calculate its percentage.
describe.value_counts(df,col)
This function requires the following parameters:
- main_data (
dataframe): Data Input - col (
string): column name
The result
| sex | n_samples | percent | |
|---|---|---|---|
| 0 | male | 577 | 64.76 |
| 1 | female | 314 | 35.24 |
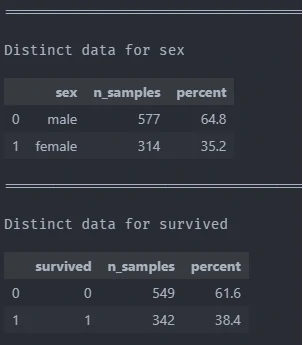
Show value count for every unique in each column
By calling, describe.n_large_small we can generate value count for every unique in multiple columns and calculate its percentage.
describe.value_counts_all(df,["sex",'survived'])
This function requires the following parameters:
- main_data (
dataframe): Data Input - col (
list): column name
The result